SUPERSTORE SALES ANALYSIS FROM (2015–2018)

Introduction
Superstore is a retail establishment offering consumer, corporate, and home office products. Our sales are exclusively conducted online, and we provide shipping services across all US states. With a diverse array of sector alternatives, we specialize in furniture, office supplies, and technology products.
Overview
This report examined the sales records of a store named Superstore for 4 years across different countries and regions.
The dataset is that of 9,800 customers, with 9,800 rows and 18 columns. Ship date, customer ID, segment, country, category, and region are a few important pieces of information about the dataset.
Data Source
To assist us with this data analysis project, Chinoso, our data instructor, provided us with this unique dataset. We are grateful for her generosity, as she has generously shared great knowledge about this career with us. This knowledge will greatly enhance our understanding and enable us to make informed, data-driven business decisions.
Data Preparation and Cleaning
- Checking for Duplicate Values: After highlighting the entire column in the dataset, I proceeded to inspect the Data Ribbon in order to identify and eliminate duplicate values. However, no duplicates were detected in the process.

2. Creating a Month Column: The business question requires us to solve some questions that include month, but in the real dataset there’s no separate column for month, so to get this, we’ll need to create a new column for it. My first attempt is to split the order date into separate columns with delimiters using the text-to-column menu with the forward slash sign (/). But the result isn’t the right answer.

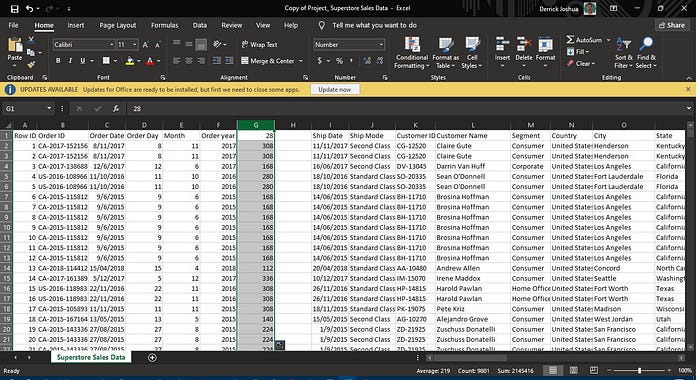
3. But after doing some research and seeking out advice from some colleagues, I was able to come up with something. I highlighted the three columns and converted them to the number data type. After converting them to numbers, I have to reduce the decimal values and make them whole numbers.

4. Two new columns were added to obtain my desired month name. Additionally, an absolute reference number of 28 was chosen. To derive the month’s name, I multiplied the values in my day column while keeping the number 28 as an absolute value.
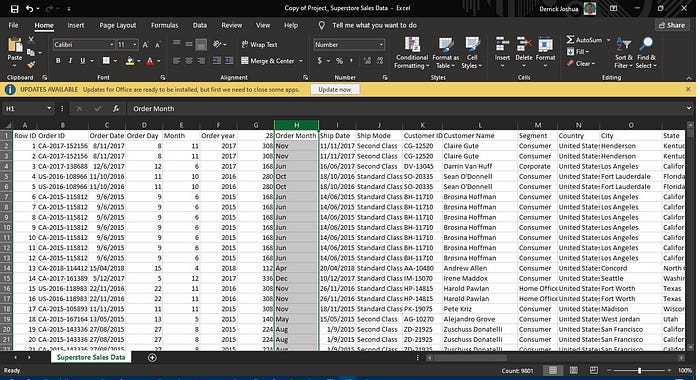
4. I used the Excel TEXT Function to convert the month values that were derived with absolute referencing to display the actual month name in text format.
Business Questions and Solution
To know how to provide insights and analysis on the problem the Superstore needed to solve, we have to use the store’s dataset that’s been cleaned to solve the business questions.
Provided below are the questions and answers to the business’s problem:
1. Total Revenue Generated: The Excel Formula Syntax =SUM(W2: W9801) or =SUM(W:W) and the returned value is $2,261,536.783
2. Highest Revenue Generated: The Excel Formula Syntax =MAX(W2:W9801) or MAX(W:W) and the returned value is $22,638.480
3. Lowest Revenue Generated: The Excel Formula Syntax =MIN(W2:W9801) or MIN(W:W) and the returned value is $0.444
4. Total Numbers of Sales Made: The Excel Formula Syntax =COUNTA(W2:W9801) or COUNTA(W:W) and the returned value is 9800
5. Number of Cities where the Business Was Located: The Excel formula Syntax =COUNT(UNIQUE(O2:O9801) and the returned value are 529 cities.
6. Determine the customers responsible for the highest and lowest sales generated by the company. Here we use an Excel formula called XLOOKUP, Syntax =XLOOKUP(AA5,W2:W9801,L2:L9801,,FALSE) and the returned value is indicated as “SEAN MILLER” as the highest customer with sales. while the lowest customer with sales is indicated as “ZUSCHUSS CARROLL” with the Syntax =XLOOKUP(AA6,W2:W9801,L2:L9801,,FALSE).
7. What is the total revenue generated in “Kentucky”: The Excel formula Syntax =SUMIF(P2:P9801,"Kentucky,"W2:W9801), and the returned value is $36,458.39.

PIVOT TABLES
Pivot tables are a powerful tool in data analysis that allows users to summarize and analyze large datasets quickly. They provide a concise and organized view of data by allowing users to rearrange and manipulate the data based on different variables. Pivot tables enable users to perform functions such as grouping, sorting, filtering, and calculating summary statistics, making it easier to uncover patterns, trends, and insights within the data. Below we will be showing our values with pivot tables:
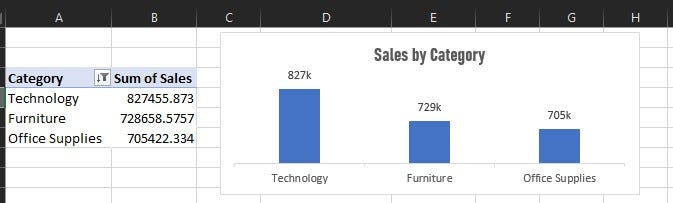
Sales by category
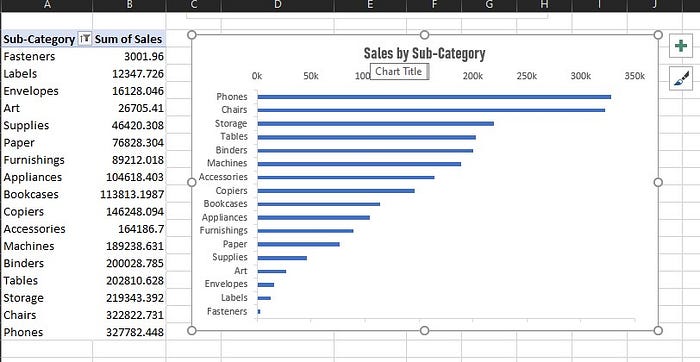
Sales by Sub-Category
Sales by Region

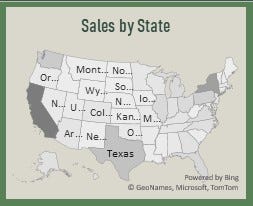
Sales by State
Sales by ShipMode

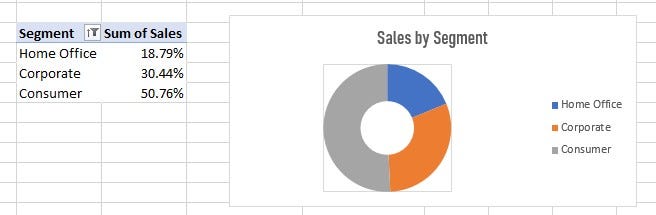
Sales by Segment
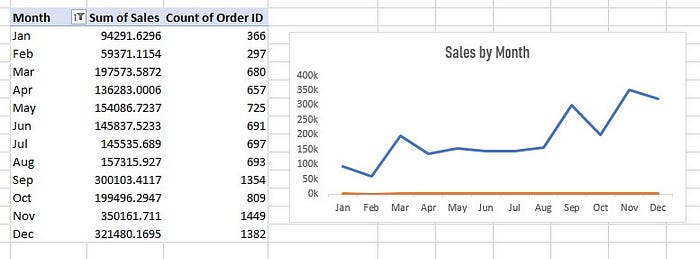
Sales by Month
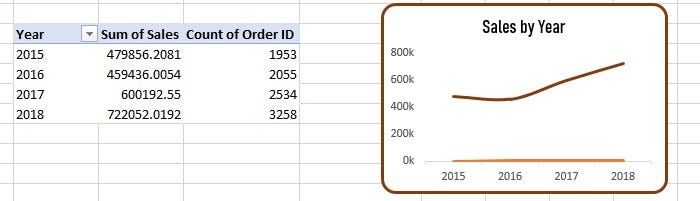
Sales by Year
FULL DATA VISUALIZATION DASHBOARD
For the full data visualization dashboard, I make use of the column chart, line chart, bar chart, and doughnut chart, and I also include the necessary KPIs that showcase some answers to the business questions.
For easy interaction with the charts on the dashboard, I added a slicer that anyone interacting with the dashboard can use.

CONCLUSION
In the US superstore dataset, we have examined and analyzed multiple use cases. By visualizing the data, we gained valuable insights into the variation of ship modes and categories among customers, which can be utilized for future improvements. Additionally, we identified the customers who generated the highest and lowest sales and the number of cities where the business is located.
Lastly, we observed patterns in the months when orders were placed.
RECOMMENDATIONS
1. It is important to ensure that popular items such as phones, chairs, storage, tables, and binder sets are always available and not out of stock.
2. It is advisable to have technology and furniture products readily accessible for customers.
3. In order to stimulate increased purchases, it would be beneficial to offer a discount that is accessible during the holiday season.
4. The advertisements and campaigns should be targeted to prioritize those residing in the top 10 most performing cities.
5. Additionally, discounts should be offered for the least performing products to entice customers to order them.
We have come to the end of this analysis.
You can connect with me on LinkedIn and Twitter.
Thanks for reading!!!
Credit to my Data Instructor